|
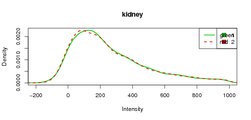
| Figure 5.2: Top: density estimates (smoothed histograms) of the green (solid line) and red (dashed line) color channels of the kidney data. The range of the data is [-561, , 35481], the x-range of the plot has been limited to [-200, ,1000] for better display. The intensities in the protect kidney dataset have been obtained from microarray image analysis software by subtracting a local background estimate from the computed feature intensities. For some of the features, the local background estimate, obtained from pixels surrounding each feature, is higher than the feature quantitation. Often this happens for dim features due to estimation noise. As an effect of the background subtraction, the locations of the two distributions are similar. Bottom: density estimates of the red and green color channels of an array from the CCl4s data. The solid lines correspond to the green channel, the dashed lines to the red. The range of the data is [37, , 65535]; the x-range of the plot has been limited to [0, ,200] for better display. In contrast to the kidney data, no local background subtraction was performed, and all intensities are positive. Also, the locations of the distributions are more disparate. A further point to note is that a large fraction of the data is concentrated at very low intensities; most features are very dim, and only a few have intensities well above background. |