|
|
|
|
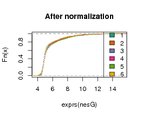
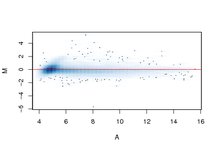
| Figure 5.10: The two panels in the upper row show the empirical cumulative distribution functions of the six arraysin esG (before normalization, left) and nesG (after normalization, right). The panel in the bottom row shows theMA-plot between a pair of arrays. | |