The
IsoGene Graphical User Interface (IsoGeneGUI) is a user friendly
interface of the IsoGene package which is aimed to perform
analysis of dose-response studies in microarray experiments.
Additionally, the GUI contains extra methods from packages orQA,
ORIClust and ORCME. The IsoGeneGUI is developed for the user with
no or limited knowledge about R programming so he/she can perform
the analysis of dose-response in microarray setting easily. This
GUI was developed using tcl/tk.
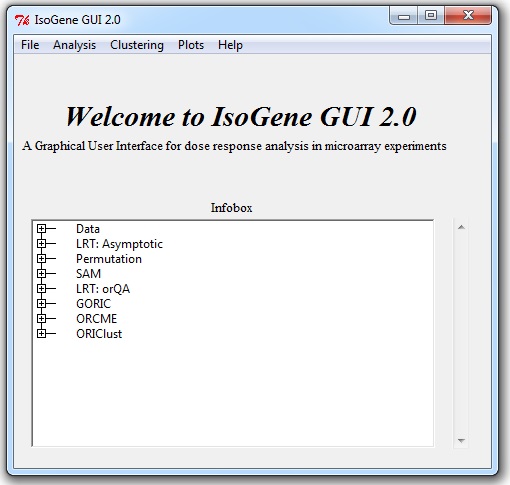
The
main window of the package is presented below.
Screenshot
of the main IsoGeneGUI window
The
GUI has five main menus and in the middle of the window there is
an info box. The package has five main menus: File, Analysis,
Clustering, Plots and Help.
File:
1. Open dataset
a. R workspace (*.RData files)
b. Excel or Text files (*.xls or *.txt files)
2. Show dataset
3. Exit
Analysis:
1. Set Seed
2. Likelihood Ratio Test (E2): Asymptotic
3. Permutation
4. Significant Analysis of Microarrays (SAM)
a. SAM Permutation
b. SAM Analysis
5. Likelihood Ratio
Test (E2): orQA
6. GORIC
Clustering:
1. ORCME
2. ORIClust
Plot:
1.
IsoPlot
2.
Permutation P-values Plots
3. SAM
Plot
a. Plot of FDR vs. Delta
b. Plot of number of significant genes vs. Delta
c. Plot of number of False Positive vs. Delta
4.
User Defined Scatter Plot
5. Plot ORCME clusters
Help:
1. IsoGene Help
2. IsoGeneGUI Help
3. About